Turning Minutes into Meaning :
Time Motion Study App, Smarter Way to Track Time.
In the middle of a mining site, every second counts. Surveyors and mechanics juggle between tracking equipment cycles, dodging moving machines, and manually writing down data, all while working under the scorching heat. Mistakes are easy to make, and keeping track of it all with paper and stopwatch can get chaotic fast.
That’s when the idea for Time Motion Study (TMS) application came up, to replace manual tracking with a digital solution. But the app needed more than just a stopwatch and data entry, it had to understand the field. It needed to be simple, fast, and intuitive, a tool that works as hard as the people using it.
Built with Purpose, Designed for Impact
Improve monitoring efficiency.
Surveyors now have an efficient and user-friendly tool that works with them, not against them, when logging heavy equipment operations in real time.
Capture data that can be trusted.
By minimizing human error and standardizing how operational times are recorded, we ensure the data is accurate and consistent.
Unlock actionable insights.
With structured logs and reliable metrics, teams can finally analyze performance trends and operational patterns in depth.
Strengthen after-sales support.
By giving stakeholders better visibility into equipment behavior, we help boost customer trust and service quality long after the unit is sold.
From Idea to Impact,
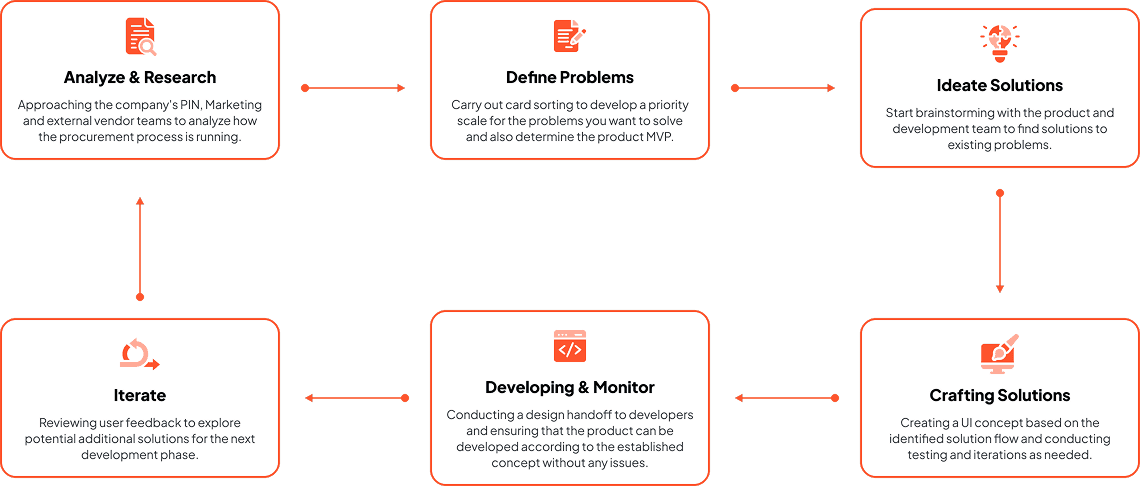
This Our Design Journey.
We started by understanding user needs and gathering detailed requirements. Then, we conducted research to gain insights and designed solutions to address key problems. After that, we validated the design results and made improvements based on user feedback.
User Interview :
We Listen, They Talk.
As the first step, we interviewed users, to understand their routines, their pain points, and what truly slows them down on the job. Through these conversations, we uncovered recurring issues and patterns. After synthesizing the data, we grouped the problems into this main categories:
by Field Surveyor
“Filling out an assessment form with too many columns can disrupt the surveyor's focus in monitoring unit movement.”
by Field Surveyor
“The surveyor must memorize the sequence of movements carried out by the heavy equipment operator, then match it with the entries on the assessment form.”
by Unit Sect. Head
“Assessment results reports are difficult to read, especially when there is a need for review with management.”
by Field Surveyor
“Making unit efficiency assessment reports increases the surveyor's workload.”
by Field Surveyor SPV
“Lack of accuracy in calculating time because the surveyor forgot to record the details of the time used.“
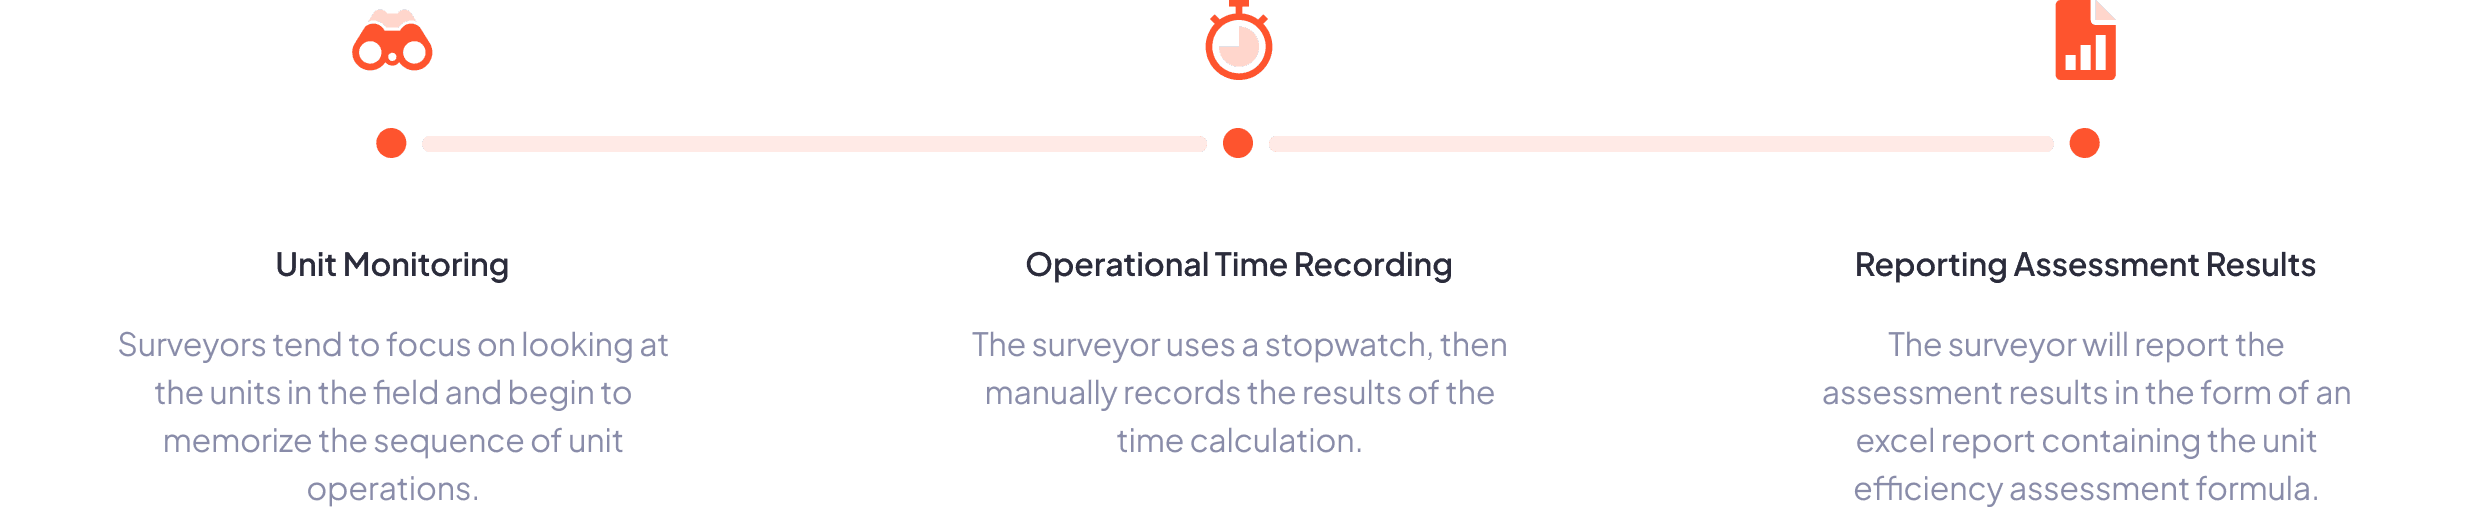
User Behaviour :
How Users Work?
After conducting interviews and observing how users work in the field, we identified several key behavior patterns. These insights gave us a clear picture of their workflow and challenges.
User Behaviour :
Behind the Stopwatch.
We then created two user personas to represent the types of users who will use this application : the field surveyor, who will conduct the time motion study, and the section head, who will review and manage the results of the time motion study for the heavy equipment.

Wiantoro Sudjatmiko
Wiantoro is a field surveyor with more than 4 years of experience in conducting time motion studies on heavy equipment units. He already has a lot of experience with various types of heavy equipment in all locations and types of work.
Goals :
Monitoring the time of operational units.
Report monitoring results to superiors.
Record fuel usage.
Constraints
Focus is easily distracted because you have to monitor the unit while filling out forms.
The workload increases because you have to report survey results.
Often forget to add detailed time records when problems occur in the unit.
Helena Kartika
Helena is a section head in the Heavy Equipment Unit division. As a division section head, he is tasked with determining policies related to R&D units in accordance with data from efficiency and productivity assessments in the field. This solution will then be presented at a management meeting with other stakeholders.
Goals :
Read the results of the unit assessment report.
Make conclusions based on the data displayed.
Attach the results of the assessment as reinforcing data for the solution he provides.
Constraints
The report results are still in the form of raw data that must be processed again.
It is difficult to know the fair value of a unit to determine the level of efficiency and productivity of that unit.

We Listened, We Observed,
Then We Designed.
After understanding the problem deeply, we moved into the solution space. This is the phase where ideas started to take shape through brainstorming and mapping. Every pain point we found now had the chance to be solved.
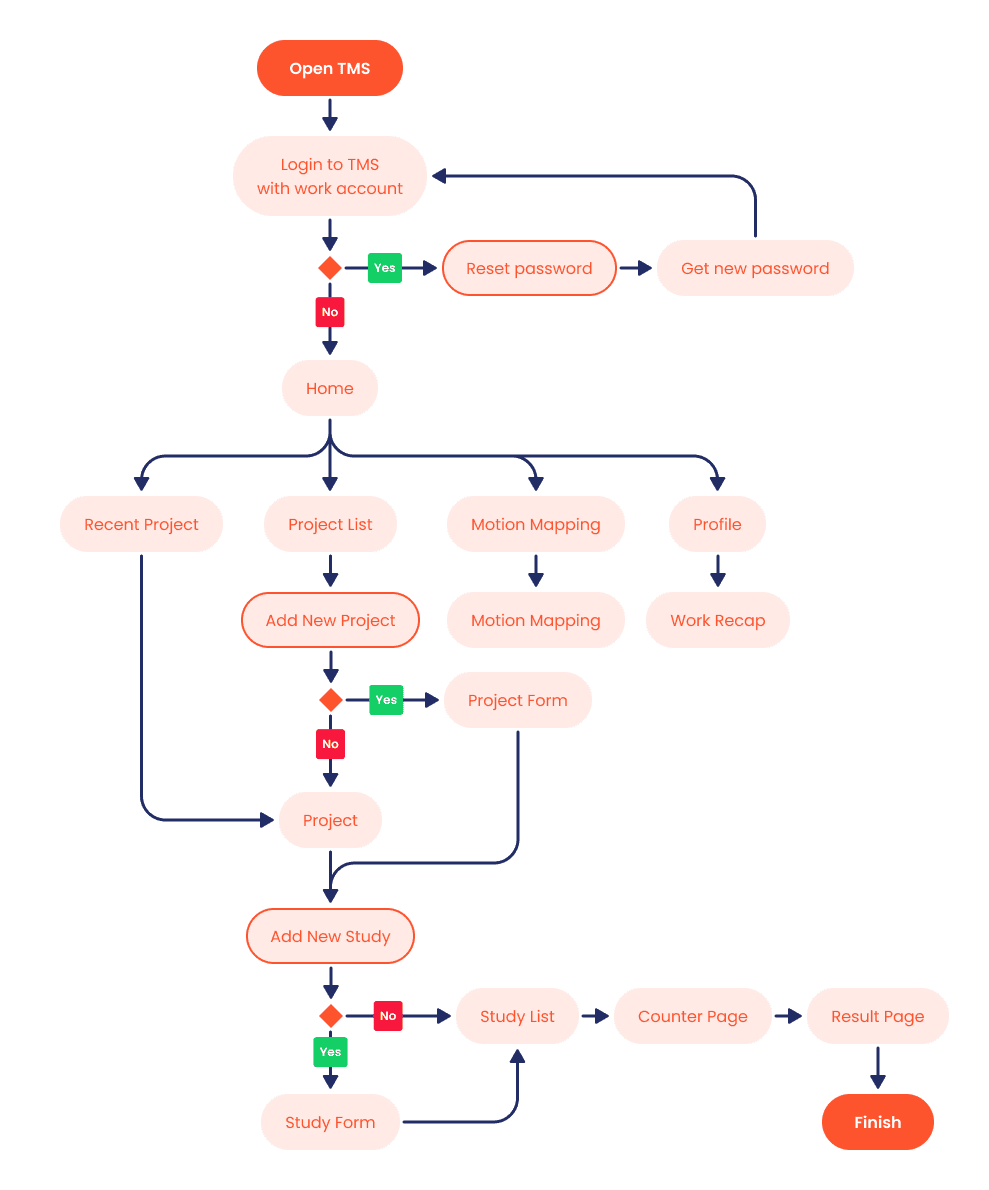
One Flow
To Match the Field.
We mapped the flow based on real case, not assumptions.
Each step was crafted to match how users actually work in the field, making the process simpler, faster, and more efficient.